By Tom Dewhurst, Co-founder, Growth Division · Updated October 2026
A growth model is a quantitative map of how your business acquires, activates, retains and monetises customers. It turns growth into a chain of numbers, such as visitors, sign-ups, activation rate, paid conversion, churn and revenue per customer, so you can see which lever moves revenue most. Growth frameworks like AARRR, Bullseye, ICE and the North Star Metric are the tools you use to build, prioritise and run that model.
We build a growth model early in every Growth Division engagement. Here is what goes into one, a worked example, the main types of growth loop and a template you can copy.
What is a growth model?
A growth model is a spreadsheet-sized description of your business engine. It answers one question: if we change this number, what happens to revenue?
It has three parts:
- Inputs: traffic by channel, spend, sales capacity.
- Conversion rates: each step from first visit to paying customer.
- Outputs: new customers, revenue, retention and lifetime value.
A good growth model is simple enough to fit on one screen and accurate enough that its forecast is within about 20% of what happens. It is not a five-year financial plan. It is a working tool for deciding what to test next.
How does a growth model differ from a growth framework?
People use the two terms loosely. The difference is useful.
- A growth model is specific to your business. It describes your numbers.
- A growth framework is a general method. It tells you how to choose channels, prioritise ideas or measure progress.
You need both. The model shows where the constraint is. The frameworks tell you how to work on it.
What does growth model maths look like?
Here is an illustrative model for a B2B SaaS company selling at £100 a month.
| Stage | Rate | Monthly volume |
|---|---|---|
| Website visitors | 20,000 | |
| Sign-ups | 4% of visitors | 800 |
| Activated (completed setup, used the core feature) | 40% of sign-ups | 320 |
| Paid | 20% of activated | 64 |
| New monthly recurring revenue (MRR) | 64 × £100 | £6,400 |
Now improve each lever by 25% in relative terms, one at a time:
| Lever | Change | New paid customers | New MRR | What it usually costs |
|---|---|---|---|---|
| Baseline | 64 | £6,400 | ||
| Traffic | 20,000 → 25,000 visitors | 80 | £8,000 | Extra media spend every month |
| Sign-up rate | 4% → 5% | 80 | £8,000 | Landing-page and offer tests |
| Activation rate | 40% → 50% | 80 | £8,000 | Onboarding work, mostly one-off |
| Paid conversion | 20% → 25% | 80 | £8,000 | Pricing, trial and sales follow-up tests |
| All four together | 156 | £15,600 |
Two lessons come out of this.
Every stage multiplies. A 25% gain anywhere gives the same 25% gain in revenue. So the lever that moves revenue most is the one with the most headroom that is cheapest to move. Buying 25% more traffic costs money every month. Lifting activation from 40% to 50% often costs one sprint of product work and keeps paying. In early-stage SaaS, activation is very often the cheapest lever.
Gains stack. Four modest 25% improvements combine to 2.4x the revenue (1.25 × 1.25 × 1.25 × 1.25 ≈ 2.44). That is why steady experimentation beats one big campaign.
Why does retention set the ceiling?
The table above is new revenue only. Retention decides how much of it you keep. Using the same 64 new customers a month:
- At 5% monthly churn, after 12 months you have about 588 customers (£58,800 MRR). The long-run ceiling is 64 ÷ 5% = 1,280 customers.
- At 3% monthly churn, after 12 months you have about 653 customers (£65,300 MRR). The ceiling rises to 64 ÷ 3% ≈ 2,133 customers.
The formula is: customers after n months ≈ new customers per month × (1 − (1 − churn)ⁿ) ÷ churn. Acquisition sets the speed; retention sets how high you can go. A growth model that ignores churn will always overstate what more traffic can do.
What are the main growth models and growth loops?
Most businesses grow through one or two dominant loops. A loop is a growth model where the output of one cycle feeds the input of the next.
| Growth loop | How it compounds | Key metric | Best fit | Watch out for |
|---|---|---|---|---|
| Paid acquisition loop | Revenue funds ad spend → ads bring customers → customers bring revenue | CAC payback period | Products with clear search or social demand and payback under 12 months | Rising CPCs; platform attribution overstating results |
| Content / SEO loop | Content ranks and gets cited by AI → visitors sign up → their questions become new content | Organic sign-ups per page published | Products where buyers research before buying | Slow start: 3–9 months before it compounds |
| Viral / referral loop | Users invite or expose others → new users sign up → they invite more | Viral coefficient (invites × invite conversion) | Collaborative or social products; strong word of mouth | Few B2B products are viral enough to rely on it alone |
| Sales-led loop | Outbound and inbound create meetings → deals close → revenue funds more sales capacity | Pipeline per rep; win rate; sales cycle length | High contract values; complex buying groups | Expensive to scale; long feedback cycles |
Most B2B SaaS companies we work with run a sales-led or paid loop first, with content building underneath. The right mix is an empirical question, which is where the frameworks come in.
How do growth frameworks fit into a growth model?
Each framework does a different job inside the model.
| Framework | What it does | Where it fits in the model |
|---|---|---|
| North Star Metric | Defines the one number that measures customer value | The model's main output, the thing everything is tested against. See our North Star Metric guide. |
| AARRR (pirate metrics) | Splits the customer journey into Acquisition, Activation, Retention, Referral, Revenue | The stages of the model itself. See what is the AARRR framework? |
| Bullseye Framework | Narrows roughly 19 traction channels to the few worth testing | Chooses which acquisition inputs and loops to test. See the Bullseye Framework explained. |
| ICE scoring | Ranks experiment ideas by Impact, Confidence and Ease | Decides which lever to work on next. See ICE scoring. |
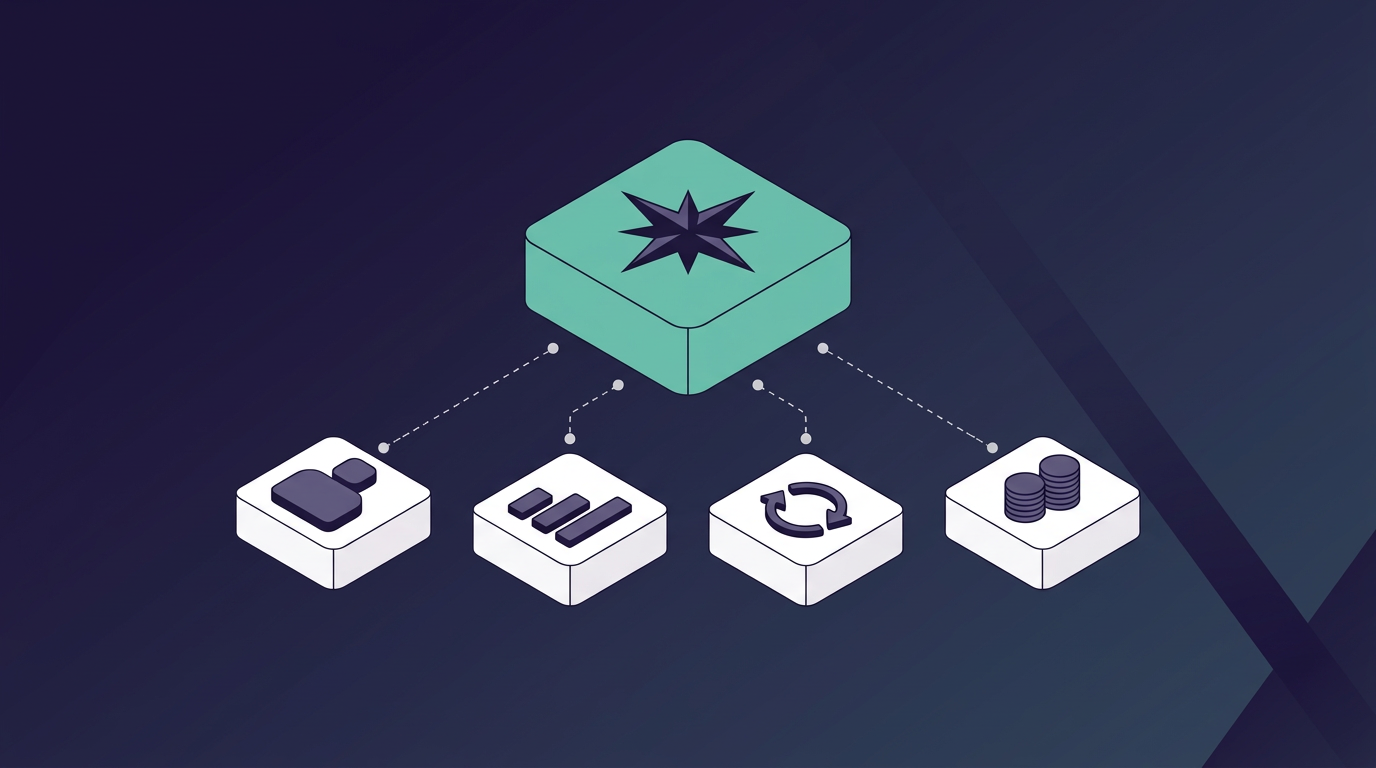
Put simply: the North Star is the destination, AARRR is the map, Bullseye picks the roads, and ICE decides which one to try this fortnight. For how these sit inside a full growth function, read building a growth marketing framework that scales your startup.
How do you build a growth model?
- Pick your North Star. Decide the one number that measures customer value, and make it the model's main output.
- Map the stages. Use AARRR as a starting structure, then rename stages to match your product.
- Fill in last month's real numbers. Pull them from analytics and your CRM. If a stage can't be measured, fixing tracking comes first. Our 9 data-driven marketing tactics post covers that.
- Find the constraint. Compare each rate with a sensible benchmark or your own best month. The biggest gap is usually the lever with most headroom.
- Model three scenarios. Ask what happens if each lever improves by 10%, 25% and 50%, and what each would cost.
- Turn the gap into experiments. Write hypotheses against the constraint, score them with ICE and run the top ones.
- Update monthly. Replace forecasts with actuals. The model should get more accurate every month.
What should a growth model template include?
Copy this outline into a spreadsheet. One tab per section is enough.
Tab 1: Inputs (monthly) - Visitors by channel (paid search, paid social, organic, referral, direct, outbound) - Spend by channel - Sales capacity (reps, meetings per rep), if sales-led
Tab 2: Funnel - Visitor → sign-up (or lead) rate, by channel - Sign-up → activated rate, with your written definition of "activated" - Activated → paid (or opportunity → closed-won) rate - Average revenue per account
Tab 3: Retention and revenue - Monthly logo churn and revenue churn - Expansion revenue - Running customer count and MRR (new + expansion − churned) - CAC and CAC payback by channel, fully loaded with team and agency time
Tab 4: Scenarios - Each lever at +10%, +25% and +50%, with the revenue impact and estimated cost
Tab 5: Experiment log - Hypothesis, lever targeted, ICE score, result, decision (scale, iterate or kill)
How we use growth models at Growth Division
- Model and Bullseye first. We build the model from the client's real data and run the Bullseye Framework to shortlist 3–6 channels.
- Two-week sprints. Experiments target the constraint the model reveals. Each one has a hypothesis, a success metric and a decision rule agreed before launch.
- GREX AI scores with ICE. GREX, our AI growth operating system, structures each experiment and scores it with ICE against the North Star. A named senior strategist reviews every score.
- Weekly reporting. We report against the North Star every week and update the model with actuals monthly. The full process is in our growth experimentation framework guide.
What are the common mistakes with growth models?
- Modelling traffic only. Most models start and end with visitors. The cheaper levers are usually further down the funnel.
- Ignoring churn. A model without retention overstates every acquisition plan.
- Blended numbers. One conversion rate across all channels hides the channel that brings browsers, not buyers. Split by channel.
- False precision. A model with 200 rows nobody updates is worse than one with 15 rows the team checks weekly.
- Building it once. If forecasts are never replaced with actuals, the model stops being a tool and becomes a pitch-deck slide.
FAQs
What is a growth model in marketing?
It is a numerical map of how a business turns attention into revenue: traffic, conversion at each stage, retention and revenue per customer. It shows which lever has the biggest effect on revenue, so the team knows what to test.
What is the difference between a growth model and a growth loop?
A growth model is the whole map of your numbers. A growth loop is one type of growth model where the output of each cycle, such as new users or revenue, feeds the next cycle's input. Most businesses have one or two dominant loops inside their model.
What are the most common growth frameworks?
The four we use most are the North Star Metric (what to measure), AARRR (the stages of the journey), the Bullseye Framework (which channels to test) and ICE scoring (which experiments to run first). They work best together, inside a growth model.
How detailed should a startup's growth model be?
Detailed enough to show the constraint, and no more. For most early-stage startups that is 15 to 30 rows: inputs by channel, four or five funnel rates, churn and revenue per customer.
Which lever usually moves revenue most?
In a multiplying funnel, equal percentage gains give equal revenue gains, so the answer is the lever with the most headroom that is cheapest to move. For early-stage SaaS that is often activation. Over 12 months, retention matters most because it sets the ceiling.
Want help building your growth model? Book a free 1-hour Bullseye Strategy Session → /contact-us. We'll map your funnel, find the constraint and shortlist the channels worth testing first.

.png)

.png)