Your dashboard is lying to you. Not on purpose, but it's showing you what's easy to count rather than what actually drives revenue.
I've sat in dozens of founder meetings where a green traffic chart hid a flat pipeline. Clicks were up, sign-ups were up, and the bank balance still told a different story.
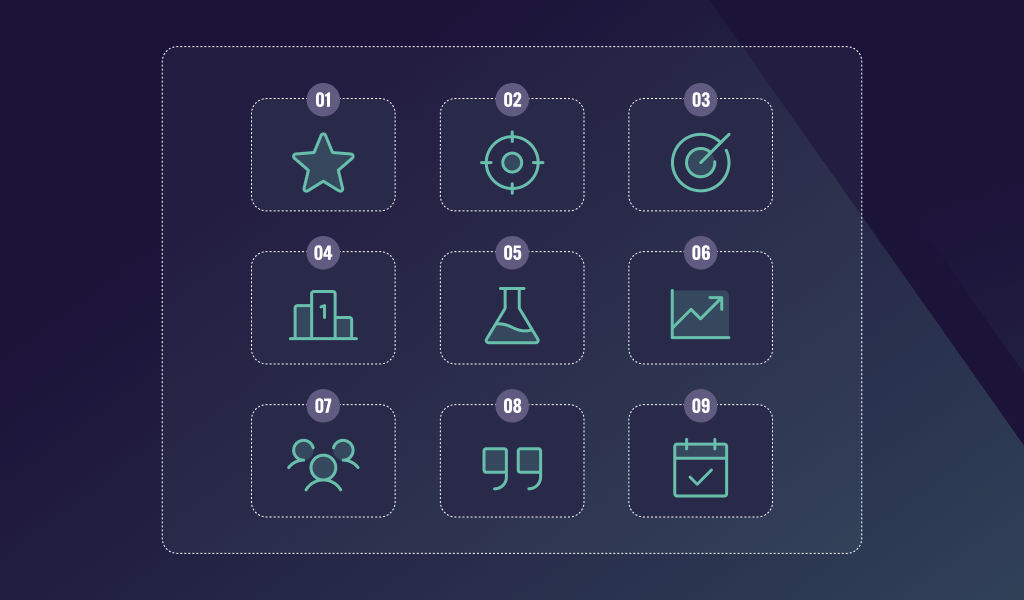
So let's fix that. Below are nine data-driven marketing tactics we use at Growth Division, our growth marketing agency. They're in the order I'd run them, each with the metric that proves it's working.
Why "data-driven" usually isn't
Plenty of startups collect data. Far fewer make decisions with it.
The gap shows up in a familiar pattern. A founder reads a report and feels good or anxious. Then they do roughly what they'd planned anyway.
Being data-driven means something narrower. It means you decide in advance what result would change your mind, then you go and measure it.
And the payoff is real. McKinsey found that intensive users of customer analytics are 23 times more likely to outperform competitors on new customer acquisition.
That's not a small edge. For a startup burning cash every month, it's often the difference between finding a channel and running out of runway.
The nine tactics at a glance
Here's the short version before we go deep. Each tactic answers one specific question, and each one has a metric that tells you whether it's working.
| # | Tactic | Question it answers | Key metric | Time to first signal |
|---|---|---|---|---|
| 1 | Pick a North Star metric | What does growth actually mean for us? | One agreed metric | 1 week |
| 2 | Fix your tracking first | Can we trust our numbers? | Attribution coverage | 1 to 2 weeks |
| 3 | Choose channels with Bullseye | Where should we look for growth? | Channels shortlisted | 2 weeks |
| 4 | Score ideas with ICE | Which experiment runs next? | Backlog ranked | 1 day |
| 5 | Run structured experiments | Did this idea work? | Success metric per test | 2 to 6 weeks |
| 6 | Track CAC and payback by channel | Which channel is profitable? | CAC, payback months | 1 month |
| 7 | Read retention cohorts | Are we keeping who we win? | Cohort retention curve | 1 to 3 months |
| 8 | Mine customer language | What should our message say? | Conversion rate lift | 2 to 4 weeks |
| 9 | Hold a weekly growth review | Are we learning fast enough? | Tests shipped per month | Ongoing |
The order matters. Tactics one and two are foundations, and three to five help you find channels. Six to nine are how you scale what works.
1. Pick a North Star metric before anything else
A North Star metric is the single number that best captures the value customers get from you. For a marketplace it might be completed transactions. For B2B SaaS it might be weekly active teams.
Without one, every channel owner optimises for their own number. Your paid person chases clicks, your content person chases traffic, and nobody owns revenue.
Why it works
It forces trade-offs into the open. When two experiments compete for budget, you pick the one likely to move the North Star.
It also makes reporting honest. You can't hide a flat quarter behind a spike in impressions when everyone agreed impressions weren't the point.
How to run it
Start with the moment a customer first gets real value. Then pick the metric that counts how often that moment happens.
Keep it to one number. Supporting metrics are fine, but they sit underneath the North Star, not beside it.
What to measure
Track the North Star weekly and chart it for everyone to see. If a tactic can't plausibly move it within a quarter, it goes to the bottom of the list.
2. Fix your tracking first
This is the least exciting tactic on the list. It's also the one I'd never skip.
If your analytics are broken, every decision downstream is a guess wearing a spreadsheet costume. And in my experience, the majority of early-stage setups have at least one serious gap.
Why it works
Clean data turns arguments into answers. When tracking is right, you can see which channel drove a demo, not just which one the founder likes best.
It also protects your budget. Ads platforms will happily take credit for conversions they didn't cause if you let them.
How to run it
We fix tracking before spending a pound on media. Our guide on data analytics for startup growth explains why. The checklist looks like this:
- Define conversion events. List every action that matters, from sign up to first payment.
- Standardise UTM parameters. One naming convention, written down, used by everyone.
- Connect your CRM. Make sure leads carry their source into HubSpot or whatever you use.
- Check for duplicates. Double-counted conversions quietly inflate every channel's results.
- Separate test traffic. Filter out internal visits, staging sites and bot noise.
- Document the setup. A one-page tracking plan saves weeks when someone new joins.
What to measure
Measure attribution coverage, meaning the share of new customers with a known source. If it's below 80%, fix that before you scale anything.
3. Choose channels with the Bullseye Framework
There are roughly 19 traction channels available to a startup. Almost nobody has the budget to test all of them.
The Bullseye Framework, from the book Traction by Gabriel Weinberg and Justin Mares, is how we narrow the field. It's the first thing we run on every Bullseye Call with a new client.
Why it works
It removes channel bias. A specialist agency will always recommend its own channel, but Bullseye starts from every option and filters with evidence.
It also stops you from spreading budget too thin. Three focused tests teach you more than ten half-funded ones.
How to run it
Brainstorm every channel in the outer ring and write one idea for each. Then move the most promising six into the middle ring.
From those six, pick the top three for real experiments. The inner ring is where budget and attention go.
What to measure
Measure early leading indicators for each channel, like cost per lead or reply rate. You're not looking for profit yet, you're looking for signal.
4. Score experiment ideas with ICE
Once you've got channels, you'll have more ideas than time. That's a good problem, but it needs a system.
ICE stands for Impact, Confidence and Ease. You score each idea from 1 to 10 on all three, then average them.
Why it works
It's quick enough to actually use. A team can score twenty ideas in half an hour and walk out with a ranked backlog.
It also makes prioritisation debatable in a useful way. Instead of "I like this idea", people argue about specific scores. We've written a full guide on how ICE scoring works if you want the detail.
How to run it
Score in a group, then compare. Big disagreements on confidence usually mean someone knows something the others don't.
Score the backlog again every month. Results from earlier tests should change your confidence in related ideas.
What to measure
Track how accurate your impact scores turn out to be. Over time, a team that scores well gets noticeably faster at finding winners.
5. Run structured experiments, not campaigns
A campaign is something you launch and hope for. An experiment is something you design to teach you something, whether it wins or loses.
Every experiment we run has three parts written down before launch: a hypothesis, a timeline and a success metric. If it doesn't have all three, it isn't ready.
Why it works
Small tests can hide huge wins. Harvard Business Review reported that one Bing headline experiment lifted revenue by 12%. That was worth over $100 million a year in the US alone.
That idea had sat in the backlog for months because it looked minor. Only a controlled test proved its value.
How to run it
Write the hypothesis as "If we do X, then Y will change by Z, because of W."
The "because" part is where the learning lives. It tells you what to try next, even when the test loses.
Set the timeline before launch, and don't stop early just because the first week looks good. Decide your sample size up front, especially for paid tests.
What to measure
Measure the one success metric you picked, nothing else. Log every result, including failures, in a shared experiment library.
📕 Want the full process? Our guide to running structured growth experiments covers templates and timelines.
6. Track Customer Acquisition Cost (CAC) and payback by channel
Blended CAC is comforting and mostly useless. It averages your best and worst channels into one number that describes neither.
So break it down and calculate CAC per channel. Then pair it with payback period, the months it takes gross margin to cover that cost.
Why it works
It shows you where to move budget. A channel with twice the CAC can still win if those customers pay back faster and stay longer.
It's also what investors ask about. A founder who can quote CAC and payback by channel sounds like someone who knows where growth comes from.
How to run it
Include everything in the cost: ad spend, tools, freelancers and a fair share of team time. Leaving out salaries makes organic channels look free, and they aren't.
Review monthly, not daily. CAC swings around in short windows, so look at trends over four to eight weeks.
What to measure
For B2B SaaS, a payback under 12 months is healthy for most early-stage businesses. Our client Addland tightened this loop and cut monthly Cost Per Acquisition (CPA) by 26.5%. They did it while scaling paid spend 11 times.
7. Read retention cohorts
Acquisition gets the attention, but retention decides whether growth compounds or leaks. And the economics are lopsided.
According to Harvard Business Review, winning a new customer costs five to 25 times more than keeping one. The same piece cites Bain research showing a 5% retention lift can raise profits by 25% to 95%.
Why it works
Cohorts show you whether things are getting better. A total churn figure mixes old customers with new ones and hides improvement.
They also tell you which channels bring customers who stick. Sometimes your cheapest channel brings your worst customers.
How to run it
Group customers by the month they signed up. Then chart what share is still active after one, three and six months.
Split cohorts by acquisition channel too. That's where you'll find the surprises.
What to measure
Look at the shape of the curve. If it flattens, you've got a core of retained users and something worth scaling.
8. Mine customer language for your messaging
Some of the best marketing data isn't in your analytics at all. It's in sales calls, support tickets, reviews and the exact search terms people use.
Customers describe problems in their own words. When your copy mirrors those words, conversion rates usually rise.
Why it works
It closes the gap between how you describe your product and how buyers think about their problem. Founders tend to lead with features, while buyers lead with pain.
It's also cheap. You already have the raw material, you just haven't organised it.
How to run it
Pull the last 20 sales call notes and highlight repeated phrases. Then check your paid search terms report for the language people type.
Turn the top three phrases into headline tests on your highest traffic landing page. When we did this style of work with Weavr, we validated four buyer personas and grew SEM leads by 87%.
What to measure
Measure conversion rate on the tested page, and lead quality downstream. A headline that lifts sign-ups but drops sales calls isn't a win.
9. Hold a weekly growth review
Every tactic above falls apart without a rhythm. Data that nobody reviews is just storage.
A weekly growth review is a 45-minute meeting. The team looks at the North Star, active experiments and next week's plan.
Why it works
It sets the speed of learning. Teams that review weekly run more tests, and more tests means more chances to find a channel that scales.
It also makes accountability normal. Every experiment has an owner who reports on it, win or lose.
How to run it
Use the same agenda every week so nobody wastes time on format. Here's the one we use:
- North Star check. Where is the number, and what moved it?
- Experiment results. What finished, what did we learn, and what's the decision?
- Live experiments. Anything blocked, broken or showing early warning signs?
- Next up. The top two ideas from the ICE backlog and who owns them.
We run this through GREX, our AI growth operating system, which pulls live metrics from tools like HubSpot and PostHog. It scores weekly results by their contribution to the North Star, so the review starts with facts rather than opinions.
What to measure
Measure experiments shipped per month. It's the best leading indicator I know for whether a growth team will find its next channel.
Putting the tactics together
These tactics work best as a sequence, not a menu. Here's how the first six months typically play out.
| Phase | Months | Tactics in focus | What good looks like |
|---|---|---|---|
| Testing | 1 to 3 | 1, 2, 3, 4, 5 | Clean tracking and three channels with early signal |
| Channel clarity | 3 to 9 | 5, 6, 7, 8 | One or two reliable channels and falling CAC |
| Scaling | 9+ | 6, 7, 9 | Budget moving to proven channels with steady payback |
This is the same timeline we use with clients. It's how Musiversal went from $100k to $1.2M ARR in 12 months. Along the way, they generated 2,000 leads a month at $30 each.
And it's how Unlock booked over 100 demos in their first three months. Their Google Ads hit an 8% click-through rate and closed 14 new customers.
Neither result came from a clever hack. Both came from picking a metric, trusting the tracking and running disciplined tests every week.
Common mistakes that break a data driven approach
Even good teams slip into habits that quietly undo the work. These are the ones I see most often:
- Measuring too many things. Twenty metrics on a dashboard means none of them drive decisions.
- Calling tests too early. A strong first week often regresses once more data comes in.
- Ignoring failed experiments. A losing test that's documented is still worth the money.
- Trusting platform attribution. Meta and Google both grade their own homework, so check against your CRM.
- Skipping the qualitative. Numbers tell you what happened, customer conversations tell you why.
None of these are hard to fix. They just need someone whose job it is to notice.
Frequently asked questions
What does data-driven marketing mean for a startup?
It means making marketing decisions based on measured results rather than instinct. In practice, that's clear metrics, reliable tracking and structured experiments reviewed on a regular rhythm.
How much data do I need before I start?
Less than you think. You can pick a North Star and fix tracking on day one, then build a data history as experiments run.
Which tactic should I start with?
Start with tactics one and two. Without an agreed metric and clean tracking, the other seven will give you numbers you can't trust.
What tools do I need?
A web analytics tool, a CRM and a simple experiment log will cover most early needs. HubSpot, PostHog and GA4 are common starting points, and a shared spreadsheet works for the log.
How long before data-driven tactics show results?
Expect early signal within one to three months. Reliable, repeatable channels usually take three to nine months, depending on budget and sales cycle length.
Can a small team do this without a data analyst?
Yes. These tactics need discipline more than technical skill. A good growth strategist can set the system up quickly.
The bottom line
Pre-seed founder with a small budget? Start with the North Star, clean tracking and one Bullseye session. That alone will stop you wasting money on channels that were never going to work.
If you've just raised a seed round, add structured experiments and ICE scoring. Your investors want to see growth, and a weekly test rhythm is the fastest way to find it.
If you're a scaleup marketing lead, focus on CAC by channel and retention cohorts. That's where you'll find the budget you're currently wasting.
Not sure where your data is letting you down? We've helped 130+ startups build this system, and the first conversation costs nothing. Book a call with our team and we'll show you where to start.



.png)
.png)