Most early-stage startups treat growth marketing like a campaign. They pick a channel, set a budget, and wait for results. When nothing works, they switch channels and try again.
That's not growth. That's burning runway, hoping something lands.
The companies that actually figure out growth do something different. They run structured experiments. Not campaigns. Not loosely defined "tests." Experiments with hypotheses, metrics, timelines, and kill thresholds, each designed to produce a learning whether it works or not.
58% of companies still make product and channel decisions based on opinions rather than data. And according to Optimizely's platform analysis, only 12% of experiments produce a positive result. Those two numbers tell you everything.
Most teams aren't running experiments. The ones that are mostly learn what doesn't work. That's not failure. That's how the model works.
An experiment that fails cleanly teaches you more than a campaign that half-works and muddies your data. This post covers a step-by-step process for running structured growth experiments at early stage.
What is structured growth experimentation?
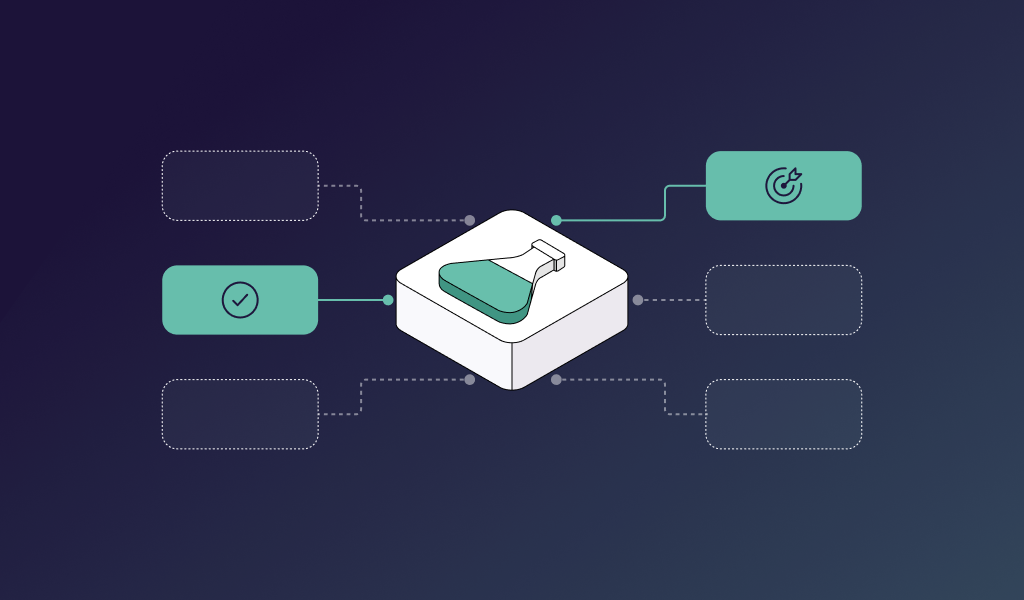
A growth experiment is not a campaign with a hypothesis taped to the front. It's a structured test with four elements: a hypothesis, a metric, a timeline, and a kill threshold.
The hypothesis predicts what will happen, and why. The metric measures whether it happened. The timeline defines when you'll read results.
The kill threshold defines what counts as failure, and it's set before the experiment starts. Without all four elements, you're not running an experiment. You're running a campaign and calling it one.
Step 1: Start with the hypothesis, not the channel
Most founders start with a channel. "We should try LinkedIn ads." "Let's run some content." That's the wrong direction.
The channel is an answer to a question you haven't asked yet. The question is: what do you believe will drive growth, and why?
A proper hypothesis follows this structure: "If we [do X], then [metric Y] will [change] by [estimated amount], because [reason]." The reason is the critical part. It forces you to articulate the mechanism, not just the action.
Here's an example of a real hypothesis: "If we run LinkedIn ads targeting Series A CFOs with a pain-point message, then qualified demo bookings will increase by 20%, because CFOs at this stage actively seek financial process tools and this channel reaches them directly." That's a hypothesis. "Let's try LinkedIn" is not.
The reason matters for a second reason. When the experiment ends, it's the mechanism you stated that you're validating. If it holds, you scale; if it doesn't, you understand why and adapt.
Step 2: Choose one metric to move
Every experiment should have one primary metric. Not three. Not a dashboard full of KPIs. One number that tells you whether the hypothesis was right.
Choosing the right metric is harder than it sounds. Most early-stage teams default to vanity metrics. Impressions, followers, and email open rates move easily and teach you almost nothing.
Pick a metric that sits as close to revenue as your traffic allows. For a high-volume consumer product, that might be signup-to-activation rate. For a low-volume B2B product, it might be demo bookings per outreach sequence sent.
Your north star metric varies by stage, from qualified conversations per week pre-revenue to logo retention at 90 days post-revenue. Define what "growth" means for your situation before designing any experiments. And measure one variable at a time.
Changing the headline, button colour, and CTA copy at once makes it impossible to attribute results. One change. One experiment.
Step 3: Set your kill threshold before you start
This is the most underused step in the experiment process. And it's the one that protects your budget and your ability to learn. Most teams skip it because it requires committing to failure before the experiment starts.
A kill threshold defines what failure looks like before the experiment begins. It's not a prediction of success. It's a floor below which you'll stop the experiment, document the learning, and move on.
Here's an example: "If this paid search campaign hasn't generated at least five qualified leads by week four, we stop, record what we learned, and move to the next experiment." Clear. Objective. Unambiguous.
Without a kill threshold, teams move goalposts. "It's only been three weeks." "The messaging isn't quite right yet." "We just need to let it run longer." These are rationalisations, not strategy.
The kill threshold forces intellectual honesty before confirmation bias has a chance to set in. Set it when you're clear-headed. Use it when the data comes back.
Step 4: Score and prioritise your experiment backlog
You'll almost always have more experiment ideas than time or budget to run them. That's a good problem. But without a prioritisation system, you'll waste resource on the wrong tests.
The ICE framework is the standard approach. ICE stands for Impact, Confidence, and Ease. Score each experiment on all three, from one to ten, and multiply the scores to get a priority rank.
- Impact: how much will this move your north star metric if it works?
- Confidence: how likely is it to work, based on what you already know?
- Ease: how quickly and cheaply can you run it?
A high-impact, low-confidence, low-ease experiment isn't necessarily wrong. But a high-impact, high-confidence, high-ease experiment should almost always go first. It generates signal fast with minimal resource.
The experiment brief that goes into the backlog should capture: the hypothesis, metric, timeline, kill threshold, ICE score, and result. Keep every brief, including the ones that failed. The learning log is a compound asset.
Step 5: Run in sprint cycles
Random, one-off experiments produce random, one-off learning. Sprint cycles create a rhythm that compounds. The difference between the two shows up in your learning log within six months.
At early stage, monthly sprints work well. Long enough to generate meaningful signal. Short enough to adapt before too much budget is committed.
At the start of each sprint, the team agrees on the top three to five experiments to run. Each has a hypothesis, metric, timeline, and kill threshold. Midpoint is a quick check to confirm experiments are running cleanly.
At sprint end, a review session reads results and feeds learnings into the next sprint. This is not a stand-up. It's a structured session that asks three questions: what did we expect, what happened, and what do we do next?
Experiment velocity matters. Top-performing growth organisations achieve 0.7 to 1.0 learnings per day, based on benchmarking studies by CXL and Mixpanel. That doesn't mean running an experiment a day.
It means the system generates a consistent, compounding stream of insights. At the early stages of growth, two or three well-designed experiments per month produce more learning than twenty loose tests with no process.
Step 6: Read results without bias
This is where most teams go wrong. The experiment ends, results are mixed, and the person who ran it finds a way to declare it a success.
Reading results clearly requires two things: statistical honesty and pre-defined criteria. Statistical honesty means understanding what your sample size can and can't tell you.
Most early-stage startups don't have enough traffic for traditional statistical significance. That's not a reason to avoid experimentation. It's a reason to use qualitative signals and leading indicators alongside raw conversion data.
Bayesian testing allows you to draw useful conclusions with as few as 200 to 500 users per variant. That's significantly fewer than the 1,000 or more required by classical significance testing. For early-stage startups, it's the more practical methodology.
Pre-defined criteria means using the kill threshold and success metric you set before the experiment started. Not the criteria that look most favourable after the data comes back.
If the experiment hit the success metric, it won. If it didn't reach the threshold and you hit the kill trigger, it failed. Both outcomes are valuable.
Step 7: Scale winners, document losers
A winning experiment doesn't mean it's time to scale to ten times the budget. It means you've validated a hypothesis. The next step is a follow-up experiment to understand why it worked.
"Our cold outreach sequence generated twelve demos last month" is a result. "It worked because the pain-point framing in the first line matched exactly what prospects said in interviews" is a learning. Scale the mechanism, not just the spend.
Document losing experiments with the same rigour. A failed experiment, if the brief was clean and the kill threshold was set correctly, is not wasted money. It's a data point that narrows the field.
After six months of structured experimentation, your learning log becomes one of your most valuable assets. It tells you what doesn't work, often more reliably than what does. And it prevents your team from running the same failed experiment twice.
How many experiments is enough?
There's no universal answer, but context helps. The median company runs two to three tests per month. Top performers run significantly more.
For most early-stage startups, three to five experiments per month is a realistic and productive cadence. That's roughly one experiment per channel you're testing. Optimizely's experimentation maturity research suggests the first twelve to eighteen months should prioritise volume over quality.
Run as many experiments as possible to build a bank of learnings. Quality over quantity becomes the focus later, once you have enough data to have real conviction about what works.
Companies running structured growth experiments monthly see 1.8 times more annual revenue growth than those that don't. The compounding effect of consistent learning outweighs the occasional big campaign every time.
The operating system that holds it all together
A good process still requires a system to run it. Spreadsheets don't hold up once you're running multiple experiments across multiple channels simultaneously.
A growth operating system replaces ad hoc tracking with structured experiment management. Hypotheses are logged. Sprints are managed. Results are recorded in one place. The whole team can see what's running, what's been learned, and what comes next.
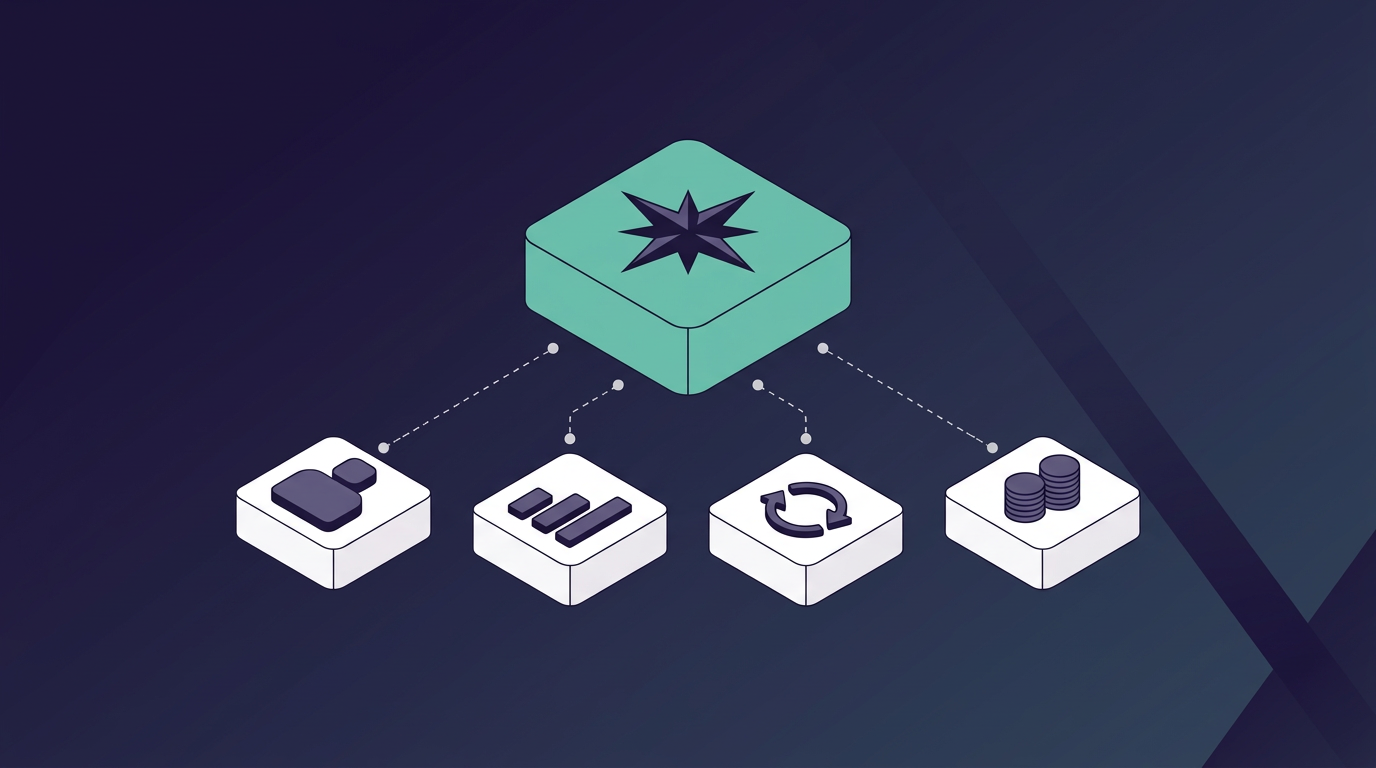
GREX is the operating system we built for exactly this. It leverages channel-level best practices, built by our team of growth experts as the base for any playbook, then the system uses AI agents to run experiments and measure performance. As the system runs it continuously learns what is working and feeds this into the playbook which becomes a store of organisation knowledge for each GTM channel you run.
Without a system, the process works until it doesn't. A missed sprint review, a learning lost from the backlog, an experiment that runs past its kill threshold. Systems prevent those failure modes.
The Growth Division model
Growth Division, our growth marketing agency, runs this framework across every client engagement. Every engagement starts with a Bullseye Call, a structured session mapping your GTM strategy and the top hypotheses to test. Nothing is budgeted until that map is clear.
From there, a channel-agnostic Growth Strategist designs the experiment backlog and scores tests using ICE. They run monthly sprint cycles and adapt the team as data comes in. Channel specialists join based on what the experiments call for, not on what the agency happens to sell.
The model adapts as data comes in. Underperforming channels get cut; channels generating signal get more resource. The team changes shape around what the experiments show, not what was assumed at the start.
We've worked with 130+ startups across the UK, US, and Europe. Musiversal scaled from $100,000 to $1.2 million ARR in 12 months. Unlock booked 100+ demos in three months, and Weavr generated 175+ MQLs per month.
Those results didn't come from picking the right channel on day one. They came from running the right process until the data showed what worked.
Frequently asked questions
What's the difference between a growth experiment and a growth campaign?
A campaign is execution. You've already decided what you're doing and you're spending to do it. An experiment is a structured test of a specific belief about what will drive growth. The goal is to learn whether the belief is correct, not just to run a channel.
How many experiments should an early-stage startup run per month?
Three to five per month is a practical target for most teams. That's enough to generate consistent learning without stretching a small team too thin. Volume matters less than rigour, and one well-designed experiment teaches you more than five loose tests with ambiguous metrics.
What if we don't have enough traffic for statistical significance?
Most early-stage startups don't, and that's fine. Bayesian testing allows useful conclusions with as few as 200 to 500 users per variant. Use qualitative signals too: customer conversations, sales recordings, and on-page behaviour give direction even without p-values.
How do we decide which experiments to run first?
Use ICE scoring: Impact, Confidence, and Ease, rated one to ten for each experiment idea. Multiply the scores and rank by the result, then run highest-ICE experiments first. Revisit the ranking at the start of each sprint, because new data often changes what the priorities should be.
How long should we run an experiment before killing it?
Set the timeline before the experiment starts, not after. Most channel experiments need four to six weeks at early stage to generate meaningful data. Set a kill threshold upfront: if the floor isn't hit by the timeline end, stop and document the learning.
How do we avoid running the same failed experiments twice?
Maintain a learning log. Every failed experiment goes in, with the hypothesis, the metric, the timeline, and what the data actually showed. Before adding a new experiment to the backlog, check the log first. A well-maintained log is one of the most valuable things a growth team builds over time.
Is there a point at which structured experimentation stops working?
Not really. The structure evolves but the principle doesn't, from high-velocity short sprints at seed stage to longer, multi-channel experiments at scale. Companies like Booking.com run 25,000 experiments per year and the discipline is the constant.
How do I know if an experiment produced a real result or just noise?
Three signals help. The result should hold at your kill threshold and success metric, set before the experiment started. You should be able to explain the mechanism, and the result should replicate in a follow-up test.
Conclusion: Treat growth like a science, not a spend
The startups that grow fastest are not the ones with the biggest budgets. They're the ones that learn fastest.
Structured experimentation is how you build that learning engine. It starts with a hypothesis, uses ICE scoring and kill thresholds to prioritise, and runs in monthly sprint cycles. A system holds it all together and turns individual experiments into compounding organisational learning.
If you want to build this process without starting from scratch, Growth Division builds it for founders. Start with a Bullseye Call at growth-division.com. We'll map your GTM hypotheses, score your top experiments, and design the sprint structure. Nothing is committed until we know what to test.



.png)
.png)