Founders can rattle off their monthly burn rate without glancing at a spreadsheet. Ask for their real Customer Acquisition Cost (CAC), and the confidence disappears.
That's a problem. CAC is one of the two or three numbers investors actually price a startup on. Get it wrong, and every metric downstream of it is wrong too.
We see this constantly. Founders quote a CAC that only counts ad spend, and it looks fine on the surface.
Then a board member asks a harder question, and the unit economics stop adding up. So this guide breaks down the exact formula.
It also covers the mistakes that quietly skew the number, and the levers that move CAC down without gutting growth. No fluff, just the numbers and the process.
What is Customer Acquisition Cost (CAC)?
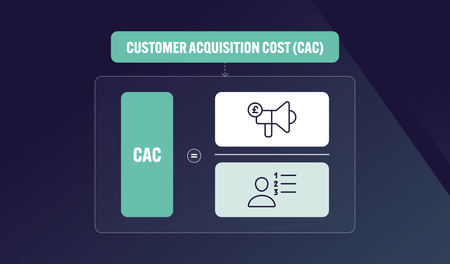
Customer Acquisition Cost, or CAC, is the average amount you spend to win one new paying customer. It adds up every dollar spent on sales and marketing over a period.
Then it divides that total by the customers acquired in the same period. Simple math, but the inputs are where most teams go wrong.
CAC isn't a vanity metric. It's a core input into how efficiently a company turns spend into revenue. It's usually the first number an investor checks against your growth story.
It's also easy to confuse with related terms. Cost per lead measures the top of the funnel, before anyone has paid you anything. CAC only counts people who actually became paying customers, which makes it a stricter and more honest number.
Why CAC matters beyond the marketing team
CAC isn't just a marketing KPI. It shapes how much runway you have and how a board reads your growth story.
It also affects whether your next raise is easy or painful.
Three groups care about this number for different reasons, and each reads it slightly differently.
- Investors use CAC alongside LTV to judge whether your growth is actually profitable, not just fast.
- Finance and the board use it to model runway, since every new customer has a real cash cost attached.
- Marketing and growth leads use it channel by channel, to decide where the next dollar of spend should go.
Get CAC wrong in a board deck, and you're not just misreporting a marketing metric. You're misrepresenting the company's actual burn efficiency.
The CAC formula
The simple version is one line.
CAC = Total Sales & Marketing Spend ÷ Number of New Customers Acquired
That's the headline formula most people quote. But a more accurate, "fully loaded" version adds every cost tied to acquisition, not just ad spend.
Add every row, divide by new customers, and you have a number that reflects reality. Skip a row, and your CAC looks artificially low.
Two rules keep the formula honest. Match your spend and your customer count to the exact same time period. And exclude anything tied to retaining or supporting existing customers.
A worked example
Say your team spent $30,000 across ads, salaries, and tools in March. That spend brought in 250 new paying customers.
$30,000 ÷ 250 = $120 CAC.
Now scale it up. A team spending $180,000 a month and closing 900 customers still lands at a CAC of $200.
A leaner team spending $10,000 to land 100 customers works out to $100 CAC. Same formula, different stage, same discipline required.
CAC across business models
CAC also behaves differently depending on how you sell. A product-led growth (PLG) company tends toward a lower, more volume-driven CAC. That's because the product itself drives signups, with less human touch per customer.
A sales-led (SLG) company runs higher, with fewer customers involved. Reps, demos, and longer cycles add real cost to every deal. Channel-led growth is more variable, since partner and referral fees replace direct spend.
Don't benchmark your CAC against a company with a different sales motion. The comparison will mislead you either way.
Blended CAC vs. paid CAC
Founders often quote one number when they mean the other. They're not interchangeable, and mixing them up leads to bad decisions.
Blended CAC includes all sales and marketing spend, paid and organic. It reflects the true cost of your entire acquisition engine. The risk is that it can hide which channels are actually carrying growth.
Paid CAC only counts paid channel spend, like ads or sponsored content. It shows how efficient one channel is, in isolation. The risk is ignoring salaries, tools, and organic contribution entirely.
Use blended CAC when you're reporting to investors or setting company-wide targets. Use paid CAC when you're deciding whether to scale, pause, or kill a specific channel.
Neither number is "more correct." They answer different questions, and a mature growth team tracks both side by side.
Common mistakes when calculating CAC
Most CAC numbers are wrong in one of these ways. Check yours against this list before you trust it.
- Excluding salaries. Counting only ad spend understates CAC, sometimes by half or more.
- Mismatched time periods. Comparing this month's spend against last month's signups distorts the ratio.
- Counting upsells as new acquisition. Expansion revenue belongs in a different metric, not CAC.
- Ignoring unconverted trials. If a free trial never converts, it shouldn't count as an acquired customer.
- Forgetting software costs. CRM, analytics, and outbound tools are acquisition costs too.
- Averaging across every channel. A blended number can hide one channel quietly burning your budget.
- Recalculating too rarely. A CAC checked once a quarter can hide a month of wasted spend.
Each of these sounds minor on its own. Stack two or three together, and the reported number can be off by 30% or more.
What counts as a "good" CAC?
CAC on its own doesn't mean much. It only becomes useful next to two other numbers: lifetime value (LTV) and payback period.
Estimating LTV first
You need a rough LTV before CAC means anything. The standard formula is straightforward.
LTV = (Average Revenue per Account × Gross Margin %) ÷ Churn Rate
A customer paying $200 a month, at 80% gross margin, with 2% monthly churn, has an LTV of roughly $8,000. That's the number CAC gets compared against.
LTV to CAC ratio
The widely cited benchmark, popularised by SaaS investor David Skok, is a ratio above 3:1. The best SaaS businesses sometimes reach 7:1 or 8:1.
LTV:CAC ratio
What it signals
Below 1:1
Losing money on every customer acquired
1:1 to 3:1
Underwater or barely sustainable long-term
3:1 to 5:1
Healthy, efficient growth
Above 5:1
Possibly underinvesting in growth, worth testing more spend
Paddle's guidance points the same direction: aim to spend 33% or less of a customer's lifetime value to acquire them.
CAC payback period
This is how long it takes to recover what you spent acquiring a customer. It matters more than the raw CAC number for cash flow.
- Under 6 months: Excellent, capital-efficient growth.
- 5 to 7 months: The benchmark range for healthy SaaS companies, per Skok's research.
- Over 12 months: Considered "anemic" and a drag on runway.
Payback period also exposes problems a static CAC number hides. Two companies can share the same CAC and have completely different cash positions.
How to optimise and lower your CAC
Lowering CAC isn't one lever. It's a set of smaller fixes that compound when you run them together.
1. Fix funnel leaks before spending more
Map conversion rate at every stage: visit, lead, opportunity, close. Find the single biggest drop-off point, since that's usually where budget is wasted. Fix that stage before you add more top-of-funnel spend.
2. Cut underperforming channels fast
Set a clear CAC ceiling per channel before you launch it. Review channel performance weekly, not quarterly. Kill channels that miss the ceiling for two consecutive periods.
3. Improve conversion on the traffic you already have
Run structured A/B tests on landing pages, not redesigns based on opinion. Simplify signup and checkout flows, since every extra field costs conversions. Use social proof, like reviews or client logos, near the point of decision.
4. Shorten time to value
Reduce onboarding friction so new customers see value fast. A faster time to value improves payback period, even if CAC stays flat. Track activation rate alongside CAC, not instead of it.
5. Invest in compounding organic channels
SEO, content, and referral programs carry a higher upfront cost but a falling CAC over time. Paid channels rarely get cheaper, while organic channels usually do once they compound. Balance both: organic alone is too slow for most funded startups.
6. Track CAC by cohort and channel, not just company-wide
A single blended CAC hides which cohort or channel is actually efficient. Break CAC down monthly, by channel, and by customer segment where possible. Cohort-level tracking catches a channel going bad weeks before the company-wide number moves.
7. Let data choose the channel mix, not habit
Most teams default to whatever channel worked last time, or whatever an agency happens to sell. That's the same problem Growth Division, our growth marketing agency for tech startups, was built to solve.
We run channel-agnostic experiments and let the results decide where budget goes next, instead of defending one channel by default. That's also the logic behind GREX, our AI growth operating system.
GREX scores channel performance against your North Star metric every week, automatically. No spreadsheet reconciliation required.
We've seen this play out with real client numbers. One client cut monthly CAC by 26.5% through structured testing.
Another consistently generated leads at roughly $30 each. That came from refining channel mix over time, not picking one bet and hoping.
CAC by channel: a quick reference
Exact numbers vary wildly by industry, geography, and competition. But the relative pattern holds across most startups we've worked with.
Channel
Typical CAC
Why
Referral and word of mouth
Very low
No media spend, high trust, slow to scale on its own
SEO and content
Low, falls over time
High upfront effort, compounds as content ranks
Outbound (email, LinkedIn)
Low to medium
Cheap to run, sensitive to list quality and targeting
Paid social
Medium
Fast to test, but costs rise as audiences saturate
Paid search
Medium to high
Competitive keywords push CPCs up quickly
Events and conferences
High
Expensive per lead, but often high intent and high ACV
Use this as a directional map, not a budget. Your own experiment data always beats a benchmark table.
How attribution distorts CAC
Attribution is the quiet problem behind most bad CAC numbers. It's rarely the math that's wrong. It's deciding which channel gets credit for the sale.
Last-click attribution, the default in most analytics tools, hands full credit to whatever channel closed the deal. A customer might see three LinkedIn ads and read two blog posts first.
If they finally convert from a Google search, that search still gets logged as the only channel that mattered. It inflates paid search CAC and makes content look worthless.
In reality, content often did the real work of building intent. Three common attribution approaches handle this differently.
Last-click attribution gives 100% credit to the final touchpoint, which suits simple reporting and short sales cycles. First-click attribution gives full credit to the first touchpoint instead, which helps you understand what starts the journey.
Multi-touch attribution splits credit across every touchpoint, fitting B2B journeys with longer cycles and multiple channels. It's harder to set up, but it's the only model that gives content, SEO, and outbound fair credit.
Without it, teams routinely defund the channels quietly doing the most work.
Tracking CAC without the spreadsheet chaos
Most early-stage teams start CAC tracking in a spreadsheet, and that's fine for a while. It stops working once spend crosses multiple channels and tools.
A basic CRM, like HubSpot or Salesforce, tracks spend, deals, and closed customers in one place. Pair it with a product analytics tool, like PostHog or Mixpanel, to connect signups to actual product usage and conversion. The goal is one source of truth, updated automatically.
An attribution or BI layer, whether that's GREX, a dashboard, or a spend tracker, pulls it together. It combines spend and results into one weekly view. Together, these three cover the essentials most early-stage teams need.
That beats five spreadsheets reconciled by hand at month end, every time. Manual reconciliation is also where most attribution errors quietly creep in.
Whatever the setup, review it on the same cadence every month. Consistency matters more than sophistication here.
Frequently asked questions
What's a good CAC for a startup?
There's no universal number. A "good" CAC is one where your LTV:CAC ratio clears 3:1 and your payback period stays under 12 months.
How is CAC different from CPA?
Cost per action (CPA) usually measures cost per lead or signup. CAC only counts customers who actually pay, which makes it a stricter, more useful number.
Should CAC include the cost of retaining existing customers?
No. Retention spend belongs in a separate metric, sometimes called customer retention cost. Mixing it into CAC understates your true acquisition cost.
How often should I recalculate CAC?
Monthly, on a rolling basis, and by channel where possible. Quarterly reviews move too slowly to catch a channel that's quietly gone underwater.
Does payback period matter more than the raw CAC number?
For cash flow, often yes. A high CAC with a short payback period can beat a low CAC that drags on for 18 months.
Can CAC be too low?
Yes. A CAC far below your LTV can mean you're underspending on growth and leaving market share on the table.
Does CAC differ between B2B and B2C companies?
Yes, significantly. B2B CAC tends to run higher, driven by longer sales cycles and multiple stakeholders.
B2C leans more on volume, brand, and shorter, lower-touch conversion paths.
Conclusion: treat CAC as a system, not a scoreboard
CAC isn't a number you calculate once for a board deck and forget. It's a live signal that should shape which channels get budget every month.
The founders who bring CAC down aren't the ones who cut spend across the board. They're the ones who fix funnel leaks, kill underperforming channels fast, and let evidence decide where the next dollar goes.
If you want an unbiased read on your channel mix and a plan to bring CAC down, we can help. Growth Division has helped 130+ startups find scalable channels without the bias of a single-channel agency.
We'll walk through your numbers and flag where CAC is leaking. Then we'll map a plan to fix it. Book a call whenever you're ready.

.png)

.png)